

Platts European SAF Weekly Commentary
European SAF premiums dip as jet fuel prices rise amid Middle East war
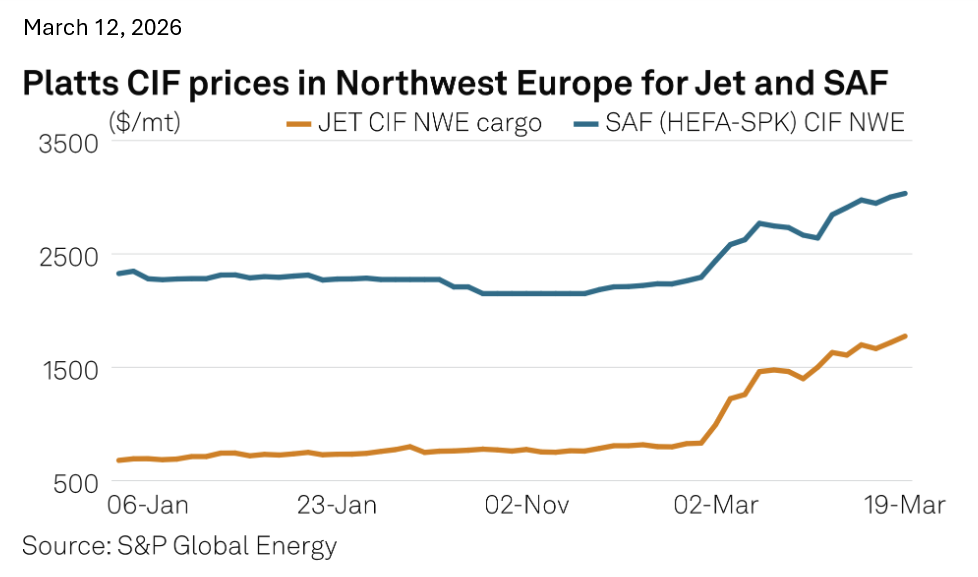
European sustainable aviation fuel prices have risen alongside other fuels since the war in the Middle East began, driven by supply line pressures; however, although bullish momentum for conventional jet fuel remains strong, the biofuel's premium over it is diminishing.
Platts, part of S&P Global Energy, assessed SAF produced via the hydrotreated esters and fatty acids pathway on a CIF basis in Northwest Europe at $2,640/metric ton on March 11. The outright price has risen from $2,294.50/mt on Feb. 27, before the war affected prices.
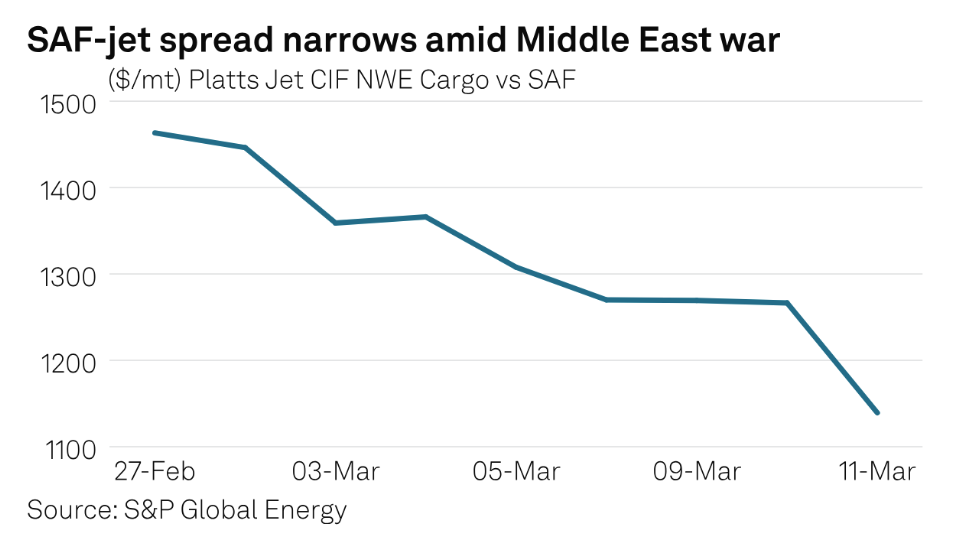
Platts assessed SAF's premium over NWE jet fuel cargoes on the same basis at $1,139 on March 11. The premium has declined from $1,463.25/mt on Feb. 27.
"Both [Renewable Diesel] and SAF prices have gone up since the war started, but at a slower pace than their relative fossil fuel counterparts, so their premiums have diminished," Ina Chirita, a biofuels analyst at S&P Global Sustainable1, said March 11.
SAF is typically priced at a premium to jet fuel, and traders often adjust the premium to insulate the outright price when the underlying fossil fuel contract experiences volatility.
Stretched supply lines
SAF production sites have not encountered the same risks as jet fuel facilities. However, one consequence of the war in the Middle East has been a significant increase in freight costs.
"The Middle East conflict is driving tanker rates higher, which does have an indirect impact on biofuel freight costs and vessel availability, as biofuels move on similar vessel types," Stena Bulk President and CEO Erik Hanell told Platts March 12.
The Platts LR2 Index, which reflects the rate to carry a 75,000 mt cargo of clean products, ended March 10 at $71,975/day, up 37% from Feb. 27, before the war.
Europe imports some SAF from Asia, and with the Red Sea now considered riskier, suppliers are taking the longer route around the Cape of Good Hope, which means greater distances and higher freight rates, Chirita said.
"So far, we are not seeing material disruptions to biofuel flows. We are closely monitoring the situation and managing exposure through forward planning, contractual coverage and close coordination with partners," Hanell said.
The spread between Platts-assessed SAF FOB FARAG in Europe and SAF FOB Straits in Singapore widened to $246.50/mt on March 11 from $213.75/mt on Feb. 27.
"Additional freight costs between Asia and the EU, along with variations in energy prices for production, have contributed to the increase in the price spread between the assessed prices," Sustainable1 analyst Christoph Berg said in a report March 11.
Since China granted higher SAF export quotas, Sustainable1 expects imports from China to Europe to increase as Chinese SAF capacity continues to grow, Chirita said.
Europe is expected to account for 31,000 barrels/day, or 54%, of global SAF demand in 2026, Sustainable1 March forecasts showed. By contrast, Europe is projected to represent about 11,000 b/d, or 19%, of global SAF production, while China accounts for 21%, Singapore for 23% and the rest of the world for 17%.
European SAF output can satisfy only 35% of its domestic demand, Sustainable1 data showed.
Major European refiners plan to ramp up SAF capacity through 2030 and beyond, while most of the output from operational SAF plants in Asia is currently targeted for export to the West, Sustainable1 analysts said in February.
Jet fuel under pressure
European jet fuel prices have risen since the start of the war.
Platts assessed the jet fuel CIF NWE cargo at $1,500.75/mt on March 11, up from $831.25/mt on Feb. 27. Meanwhile, jet fuel CIF NWE differentials set another record March 11, climbing to a premium of $400/mt over the Mo1 ICE low sulfur gasoil futures contract, Platts data showed. This followed the breaking of three consecutive all-time high records on March 3, 4 and 5, amid concerns about supply tightness.
The Persian Gulf accounted for 43% of jet fuel imports to Europe in 2025, according to S&P Global Commodities at Sea. Europe imported 616,600 b/d of jet fuel in 2025, CAS data showed.
During 2025, Kuwait was the largest exporter of jet fuel to Europe, at 155,500 b/d, followed by India at 86,900 b/d and the UAE at 69,300 b/d, according to CAS.
Earlier in March, Saudi Arabia's largest refinery, Ras Tanura, temporarily halted operations as a precaution after drone debris fell on its site, while all three oil refineries in Kuwait -- the 346,000 b/d Mina Al-Ahmadi, the 454,000 b/d Mina Abdullah and 615,000 b/d Al-Zour -- operated at around half their capacity because of a blanket reduction in throughput due to the war.
"Europe's jet fuel supply is increasingly vulnerable due to structural changes in its refining landscape," the International Air Transport Association said on its website in November.
Listen to the article here > European SAF premiums dip as jet fuel prices rise amid Middle East war | S&P Global
Would you like to learn more?
© 2026 by S&P Global Energy, a division of S&P Global Inc. All rights reserved.
S&P Global, the S&P Global logo, S&P Global Energy, Platts, and Fertecon are trademarks of S&P Global Inc. Permission for any commercial use of these trademarks must be obtained in writing from S&P Global Inc.
You may view or otherwise use the information, prices, indices, assessments, content, analysis and other related information, graphs, tables and images (collectively, “Data”) in this report only for your personal and internal use or, if you or your company has a license for the Data from S&P Global Energy (“SPGE”) and you are an authorized user, for your company’s internal business use only. You may not publish, reproduce, extract, distribute, retransmit, resell, create any derivative work from and/or otherwise provide access to the Data or any portion thereof to any person (either within or outside your company, including as part of or via any internal electronic system or intranet), firm or entity, including any subsidiary, parent, or other entity that is affiliated with your company, without SPGE’s prior written consent or as otherwise authorized under license from SPGE. Any use or distribution of the Data beyond the express uses authorized in this paragraph is subject to the payment of additional fees to SPGE.
SPGE, its affiliates and all of their third-party licensors (i) disclaim any and all warranties, express or implied, including, but not limited to, any warranties of merchantability or fitness for a particular purpose or use as to the Data, or the results obtained by its use or as to the performance thereof; (ii) do not guarantee the adequacy, accuracy, timeliness and/or completeness of the Data or any component thereof or any communications (whether written, oral, electronic or other format), with respect thereto, and (iii) shall not be subject to any damages or liability, including but not limited to any indirect, special, incidental, punitive or consequential damages (including but not limited to, loss of profits, trading losses and loss of goodwill).
Data in this report includes independent and verifiable data collected from actual market participants. Users of the Data should not rely on any information and/or assessment contained therein in making any investment, trading, risk management or other decision.
ICE index data and NYMEX futures data used herein are provided under SPGE’s commercial licensing agreements with ICE and with NYMEX. You acknowledge that the ICE index data and NYMEX futures data herein are confidential and are proprietary trade secrets and data of ICE and NYMEX or its licensors/suppliers, and you shall use best efforts to prevent the unauthorized publication, disclosure or copying of the ICE index data and/or NYMEX futures data.
The Data in this report contains the results of SPGE’s independent research and analysis and is intended for general informational purposes only. The Data is not intended, and may not be used, to promote, directly or indirectly, the supply or use of any product or business interest, including, but not limited to, the benefits of any product, business, or business activity for protecting or restoring the environment or mitigating the causes or effects of climate change. No Data or opinions contained herein constitute a representation to the public with respect to the benefits of any product, business or business activity, and should not be relied on as a recommendation for any specific action to be taken.
Any queries or requests pursuant to this notice should be addressed to SPGE via email at Legalnotices.energy@spglobal.com