

SAF production offers potential energy security boost: BP
EU cover crops could meet 2030 SAF targets
Long-term offtake deals needed for project financing
Incentive complexity challenges global production costs
Sustainable aviation fuel production could enhance energy security by creating local feedstock sources, though divergent global incentives risk complicating project economics and investment decisions, producers said May 14.
Extended supply lines for jet fuel, which have been rattled by the war in the Middle East, following earlier EU sanctions on imports of Russian refined products, have sparked concerns about jet fuel prices and potential threats to supply.
“It's a huge opportunity to create local feedstocks,” Andrea Moyes, Aviation Sustainability Director at Air BP, said during the International Air Transport Association’s Aviation Energy Forum in Paris.
There have been calls for investment happening where the feedstocks are, which is overseas, “but with crops, you can actually create a local energy security,” she said.
BP has calculated that in the EU, if cover crops were planted on 10% of arable land, “that alone could supply about 5 million metric tons of SAF, which is almost the entire -- probably more than the target that we have in 2030,” she said.
The Persian Gulf exported 528,000 b/d of jet fuel in 2025, of which 222,000 b/d went to Northwest Europe and 43,000 b/d went to the Mediterranean, according to data from S&P Global Commodities at Sea.
SAF supplies for Europe are also exposed to overseas production and, therefore, extended supply lines. Global production of SAF will be 64,000 b/d in 2026, of which Europe will account for 54%. It will only account for 12% of production, according to data from S&P Global Horizons. Global SAF demand will reach 75,000 b/d in 2027, but demand growth is slowing down, Global Horizons analysts said May 7.
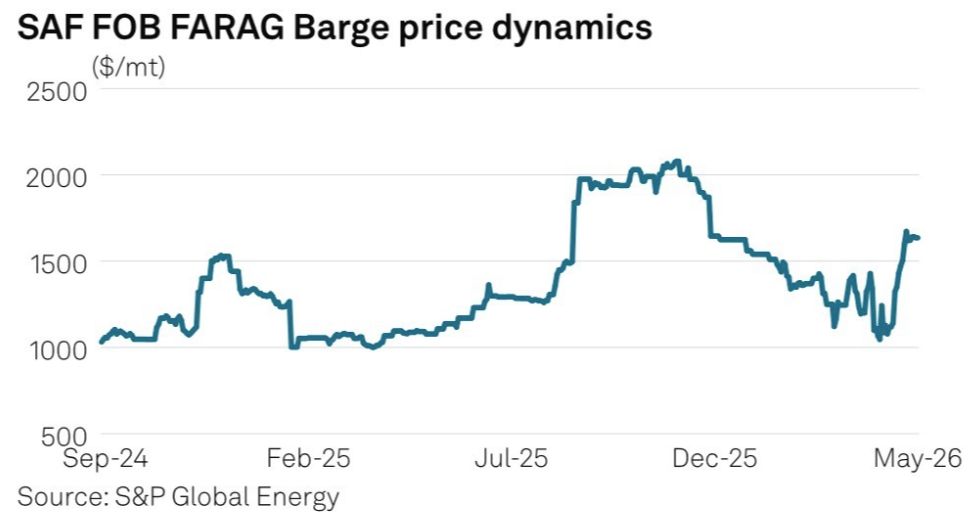
SAF commands a significant premium over jet fuel. Platts, part of S&P Global Energy, last assessed SAF, produced via the HEFA pathway, on a CIF basis in Northwest Europe at $3,003.50/mt May 13, compared to
$1,325/mt jet cargoes on an equivalent basis.
Incentive challenges
This comes amid a complex regulatory regime for SAF.
The EU's ReFuelEU Aviation regulation mandates progressive increases in SAF blending at EU airports, reaching 6% by 2030 and 70% by 2050. A sub-mandate requires e-SAF to comprise 1.2% of the fuel mix by 2030, rising to 35% by 2050.
While the regulatory framework provides a foundation for capacity expansion, producers need credible long-term demand signals beyond mandated volumes to secure project financing, Nicole Loeschl, Advisor Sustainable Aviation at OMV, said May 14.
“It needs to have a credible global demand signal out in the market that is also willing to go into long-term commitments at acceptable price levels because in the end, these puzzle pieces together make it possible to have credible bankable projects that will pass a successful FID for a capacity coming up,” Loeschl said.
The emergence of different incentive structures across regions is creating an uneven playing field that increases costs and complexity, particularly for demand exceeding mandated levels, Loeschl said.
US-incentivized production now competes with European output under different cost structures and regulatory requirements, complicating investment decisions for projects that require long-term offtake commitments at acceptable price levels to achieve final investment decisions.
"The more incentives come up, the more complex it is because usually incentives and more different locations and having different incentives and different motivations usually increase costs and complexity," Loeschl said. "This is our concern about this."
Corporate Scope 3 emissions commitments are driving demand beyond regulatory mandates, making incentives increasingly important for unlocking project potential in early years, she said. The combination of stable policy frameworks, credible demand signals, long-term commitments and appropriate incentives are necessary to create bankable projects, Loeschl added.
Would you like to learn more?
© 2026 by S&P Global Energy, a division of S&P Global Inc. All rights reserved.
S&P Global, the S&P Global logo, S&P Global Energy, Platts, and Fertecon are trademarks of S&P Global Inc. Permission for any commercial use of these trademarks must be obtained in writing from S&P Global Inc.
You may view or otherwise use the information, prices, indices, assessments, content, analysis and other related information, graphs, tables and images (collectively, “Data”) in this report only for your personal and internal use or, if you or your company has a license for the Data from S&P Global Energy (“SPGE”) and you are an authorized user, for your company’s internal business use only. You may not publish, reproduce, extract, distribute, retransmit, resell, create any derivative work from and/or otherwise provide access to the Data or any portion thereof to any person (either within or outside your company, including as part of or via any internal electronic system or intranet), firm or entity, including any subsidiary, parent, or other entity that is affiliated with your company, without SPGE’s prior written consent or as otherwise authorized under license from SPGE. Any use or distribution of the Data beyond the express uses authorized in this paragraph is subject to the payment of additional fees to SPGE.
SPGE, its affiliates and all of their third-party licensors (i) disclaim any and all warranties, express or implied, including, but not limited to, any warranties of merchantability or fitness for a particular purpose or use as to the Data, or the results obtained by its use or as to the performance thereof; (ii) do not guarantee the adequacy, accuracy, timeliness and/or completeness of the Data or any component thereof or any communications (whether written, oral, electronic or other format), with respect thereto, and (iii) shall not be subject to any damages or liability, including but not limited to any indirect, special, incidental, punitive or consequential damages (including but not limited to, loss of profits, trading losses and loss of goodwill).
Data in this report includes independent and verifiable data collected from actual market participants. Users of the Data should not rely on any information and/or assessment contained therein in making any investment, trading, risk management or other decision.
ICE index data and NYMEX futures data used herein are provided under SPGE’s commercial licensing agreements with ICE and with NYMEX. You acknowledge that the ICE index data and NYMEX futures data herein are confidential and are proprietary trade secrets and data of ICE and NYMEX or its licensors/suppliers, and you shall use best efforts to prevent the unauthorized publication, disclosure or copying of the ICE index data and/or NYMEX futures data.
The Data in this report contains the results of SPGE’s independent research and analysis and is intended for general informational purposes only. The Data is not intended, and may not be used, to promote, directly or indirectly, the supply or use of any product or business interest, including, but not limited to, the benefits of any product, business, or business activity for protecting or restoring the environment or mitigating the causes or effects of climate change. No Data or opinions contained herein constitute a representation to the public with respect to the benefits of any product, business or business activity, and should not be relied on as a recommendation for any specific action to be taken.
Any queries or requests pursuant to this notice should be addressed to SPGE via email at Legalnotices.energy@spglobal.com